Two counties. One shoreline. The same reporting window. Talbot County's median home price climbed 12.4 percent this year. One county over, Dorchester County's median fell 4.8 percent. If you're weighing Cambridge against Easton right now using nothing but the headline numbers you found on a portal, you're actually comparing two different stories that happen to sit on the same peninsula.
Here's the number that matters more than either median: what's actually selling in each county, and to whom.
The Number Everyone's Reading the Same Way
A regional market report covering June and July 2026 put the Eastern Shore's overall median home price at roughly $410,000, up 3.8 percent year over year. That regional figure sounds stable. It isn't, once you split it by county. Talbot County, home to Easton, recorded a median of $539,500 during that window, up 12.4 percent from the year before. Dorchester County, home to Cambridge, recorded a median of $295,000, down 4.8 percent over the same stretch.
Same report. Same six-county region. Opposite direction. The report itself makes the point plainly: conditions in one county can look nothing like conditions in the next one over, and even towns inside the same county can diverge from each other. That's not a footnote. It's the actual finding.
If you're a buyer or seller trying to decide between Cambridge and Easton based on which county's median is bigger or smaller this year, you're asking the number to do a job it was never built for.
What's Actually Dragging Cambridge's Median Down
Cambridge-specific tracking through the first half of 2026 tells a more textured version of the Dorchester County story. One widely used home value index put Cambridge's average value at $265,895 as of May 2026, up a bare 0.2 percent for the year, essentially flat. A separate market tracker showed Cambridge's average sale price down more than 20 percent year over year, with the town scoring low on that tracker's competitiveness scale. A third source pegged Cambridge's median days on market at 97 in May 2026, up from 68 days a year earlier, alongside a price per square foot that was down 5 percent year over year as of June 2026.
Three different trackers, three different exact figures, but they all point the same direction: homes are sitting longer, selling for less relative to list price, and moving through a slower negotiation cycle than they were twelve months ago.
None of that describes a single home. It describes an average built from a lot of homes, and Cambridge's transaction volume is dominated by in-town and inland housing stock, plus a meaningful share of foreclosure and pre-foreclosure activity that shows up in every county-level search of Cambridge listings. A rowhouse near downtown that sits for 90 days and sells below list drags the same median as a waterfront estate that sells in three weeks at full price. The math doesn't distinguish between them. You have to.
What the Median Never Sees
Search Dorchester County's waterfront inventory right now and the county median gets harder to square with what's actually on the market. A 255-acre multi-residence estate called Parsons Creek Farm sits at the confluence of Parsons Creek and the Little Choptank River, built around deep water access, wetlands, and managed wildlife habitat. That property isn't competing against the Cambridge rowhouse dragging the average down. It's competing against nothing comparable in the county at all.
The same is true up and down Cambridge's shoreline, in pockets that never show up as a single line item in a portal's summary chart:
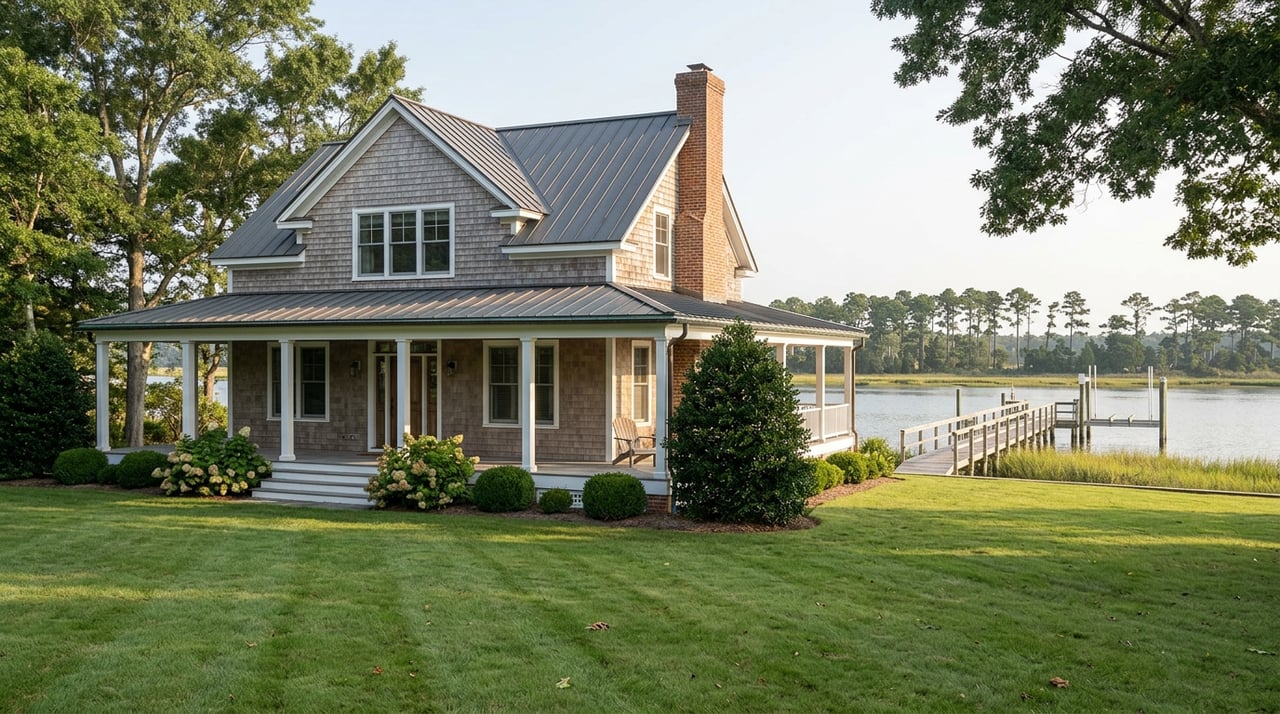
- Cambridge Creek and Long Wharf, where waterfront condos and cottages sit close enough to downtown to walk to dinner but still carry panoramic views of the creek meeting the Choptank River, anchored by a working marina.
- The Historic West End District, where homes dating to the late 1800s and early 1900s sit near the Cambridge Yacht Club and Marina, trading on architectural character as much as square footage.
- Church Creek, where one current listing advertises more than 470 feet of protected shoreline, a private dock with four feet of water depth, and a boat lift, sitting inside the Cambridge South Dorchester school boundary.
- Brooks Creek, where a separate listing offers nearly 2,000 feet of water frontage with sandy beaches, a private pier, and a pond.
- Longboat Estates on Jenkins Creek, a planned waterfront community built around shared pier and pool access rather than individual dock ownership.
Each of these trades on frontage footage, dock depth, acreage, and in some cases historic designation. None of that shows up in a county median. A property with 470 feet of protected shoreline and a private dock is playing a different game than a three-bedroom rowhouse two blocks off Route 50, even though both get folded into the same Dorchester County number when someone runs the math.
Why Talbot Looks Different Without Necessarily Being Different
It's tempting to read Talbot County's 12.4 percent jump as proof that Easton is simply the stronger market and Cambridge is falling behind. The more accurate read, based on what the regional report itself says, is that Talbot's median is being pulled by its own mix of transactions, the same way Dorchester's is being pulled by its mix.
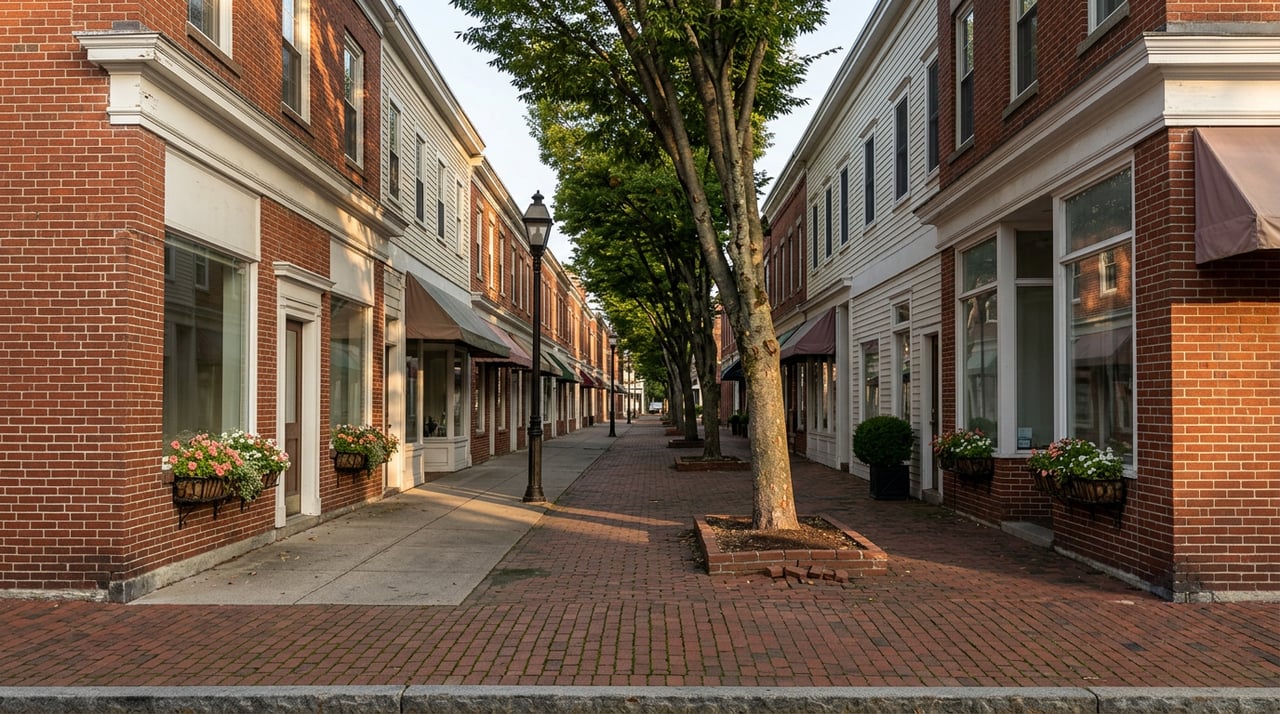
Talbot County's number includes Easton's historic downtown core, one of the more concentrated inventories of well-preserved 18th and 19th century architecture on the Shore, sitting inside a National Register historic district that's stayed largely intact since it was listed in 1980. A county median built partly around that kind of inventory is going to behave differently than one built around a broader spread of foreclosure listings, inland ranch homes, and entry-level housing stock, which is closer to what's driving Dorchester's current mix.
That's not a value judgment about either county. It's a composition effect. The report's own language on this is direct: location, condition, acreage, waterfront access, improvements, property type, and competing inventory all substantially influence value, and none of that gets captured by a single median.
Reading These Numbers for Your Own Search
If you're comparing Cambridge to Easton, or comparing a specific Cambridge waterfront listing to whatever the county median says this month, the county figure is a starting point for a conversation, not a verdict on your property or your offer.
What actually tells you something: how long comparable waterfront or historic properties in your specific price band and specific creek or district have taken to sell over the past few months, not the past twelve. What the price per square foot looks like for homes with similar frontage and dock infrastructure, not for the county as a whole. Whether the property you're watching is competing against a stack of similar listings or standing alone in its category, the way a 255-acre estate at the mouth of a river simply doesn't have five comparable neighbors to be measured against.
Days on market matters here too. Cambridge's median rose from 68 to 97 days over the year leading into May 2026, but that number blends fast-moving, well-priced waterfront listings with inland homes that may be sitting for entirely different reasons, condition, pricing strategy, or a buyer pool that's simply thinner for that particular type of property. A waterfront estate that's been on the market 40 days isn't necessarily underperforming. It may be performing exactly at pace for its category.
A Few Questions Worth Asking
Does a falling Dorchester County median mean Cambridge waterfront values are dropping too? Not necessarily. The county figure blends a large volume of inland and in-town sales, including foreclosure activity, with a much smaller pool of distinctive waterfront and historic properties. A drop in the blended number doesn't automatically mean the waterfront segment moved the same direction or by the same amount.
Why did Talbot County's median rise so much more than Dorchester's in the same period? Both counties are being shaped by the mix of what actually sold, not a uniform shift in value across every home. Talbot's inventory includes Easton's concentrated historic downtown core. Dorchester's includes a broader spread of inland and entry-level housing stock. Different mixes produce different medians even when neither county is uniformly rising or falling.
How should I use days-on-market data if I'm watching a specific waterfront listing? Compare it to other properties with similar frontage, dock access, and price point rather than to the county-wide average. A property with unusual acreage or shoreline may simply have a smaller pool of qualified buyers, which extends the timeline without signaling a pricing problem.
Where This Leaves You
Headline medians are useful for spotting that something is happening across a region. They're the wrong tool for deciding what a specific waterfront estate on Cambridge Creek, a historic home in the West End District, or a working farm along the Little Choptank is actually worth right now. That work happens property by property, comparing the right handful of comparable sales rather than an entire county's worth of transactions that have almost nothing in common with each other.
If you're trying to figure out what a specific Cambridge property is actually doing in this market, or how it stacks up against something similar in Easton, The Linthicum Group can walk through the comparables that actually apply to your search rather than the county average that doesn't.